
Sample Project
RiverBend Grill
This sample project shows how SRC turns existing restaurant reports into clear findings, practical recommendations, and estimated financial impact.
RiverBend Grill is a fictional full-service American restaurant created for demonstration purposes.
Project Overview
Turning scattered reports into a clearer operating picture.
RiverBend Grill wanted a clearer understanding of profitability during the first quarter. The review focused on sales, labor, guest count, average check, and available cost data.
The goal was not just to summarize numbers, but to identify where management could take practical action to improve performance.
What Was Reviewed
Available sales, labor, and operational data.
Sales & Guest Trends
Monthly sales, daily sales, guest counts, average check, and day-of-week performance.
Labor Performance
Labor percentage, labor dollars, sales per labor hour, and weekday versus weekend labor patterns.
Cost Review
Available food cost, vendor invoice, inventory, and P&L data were reviewed for possible cost opportunities.
Key Findings
The numbers pointed to three main opportunities.
Sales Were Stable
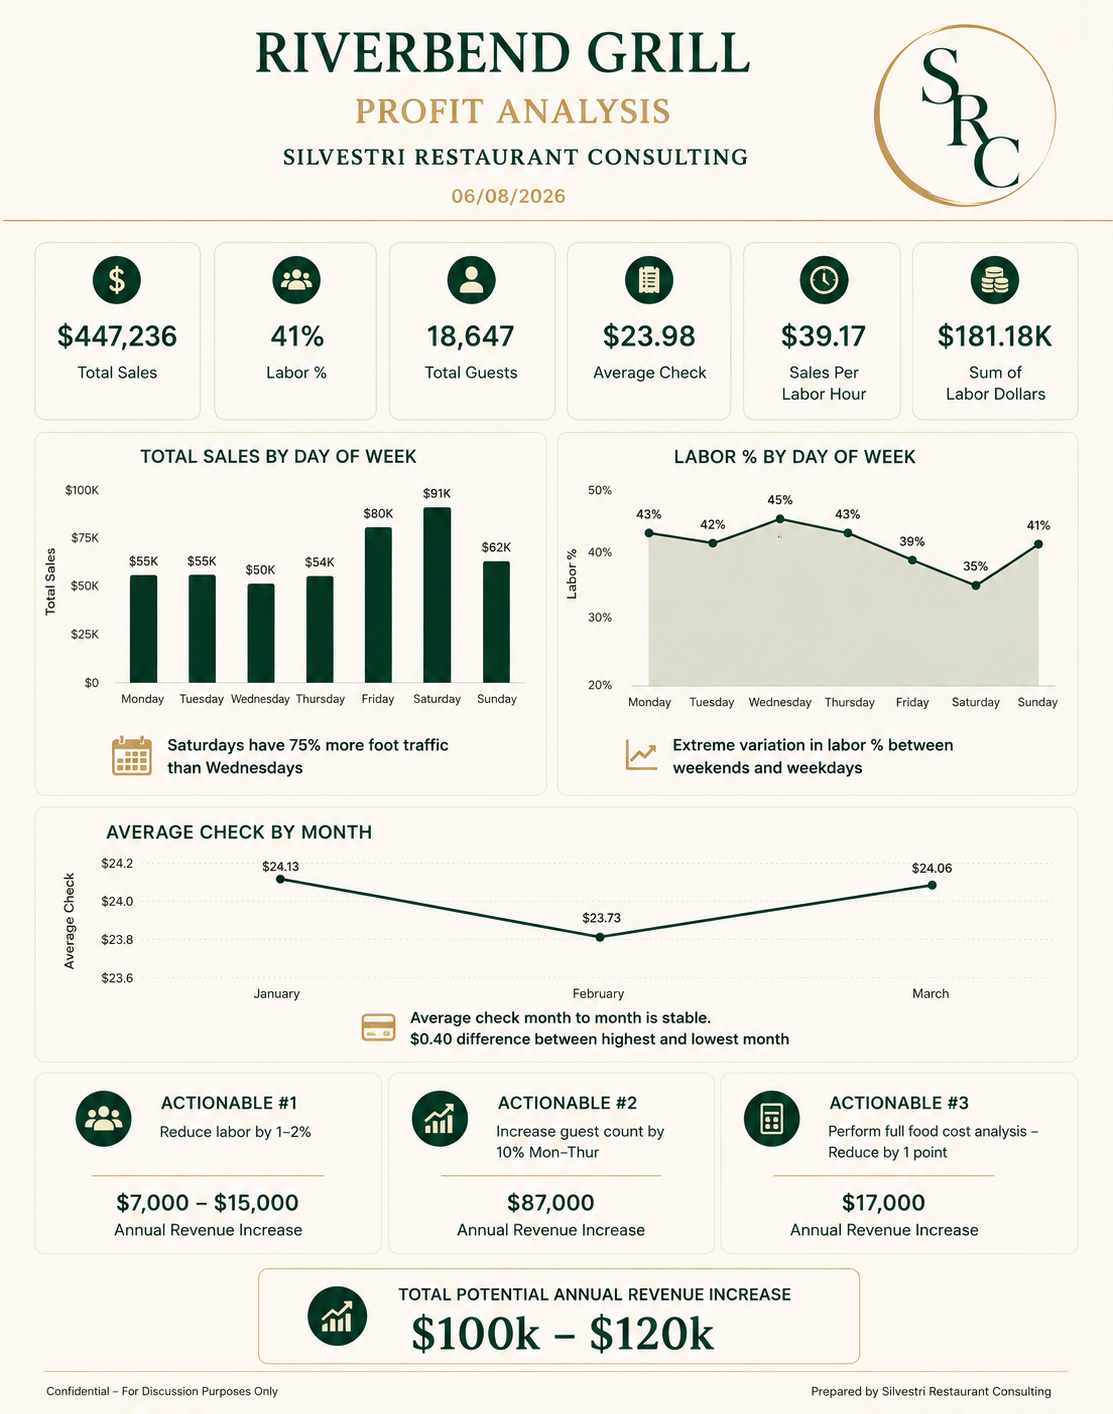
Monthly sales stayed fairly predictable across the quarter, with January at $157,366, February at $137,741, and March at $152,130.
Average Check Was Steady
Average check stayed around $24, suggesting growth would most likely come from increasing guest count rather than relying on higher guest spend.
Weekday Traffic Lagged
Wednesday traffic was much lower than Saturday traffic, creating an opportunity for weekday sales-building efforts.
Labor Needed Closer Review
February sales dropped by about $30,000, but labor did not decrease proportionally, suggesting a scheduling and labor management opportunity.
Food Cost Needed Better Data
January invoice data was missing, so a full food cost analysis could not be completed. This became a priority recommendation.
KPIs Needed Ongoing Tracking
Weekly tracking of sales, guest count, average check, labor percentage, SPLH, and food cost was recommended for better management visibility.
Recommendations
Practical next steps tied to measurable impact.
- Complete food cost analysis
Recover missing invoice data and compare food cost to P&L results. - Run menu mix analysis
Identify high-profit items, underperforming items, and pricing opportunities. - Build weekday traffic
Focus marketing on Monday through Thursday instead of already-strong weekend demand. - Review hourly sales and schedules
Align staffing more closely with demand and reduce labor during slower periods. - Implement weekly KPIs
Track core metrics weekly so issues are identified earlier.
Estimated Impact
Small operational improvements can create meaningful results.
$87,000
Estimated annual revenue increase from growing Monday–Thursday guest count by 10%.
$7,000–$15,000
Estimated annual impact from reducing labor percentage by 1–2 points.
$17,000
Estimated annual impact from reducing food cost by one percentage point.
Total Estimated Opportunity
$100k–$120k
Potential annual impact from the key recommendations identified in the sample analysis.
Every restaurant has a story hidden in its numbers.
SRC helps owners understand what their reports are really saying.
Request Consultation